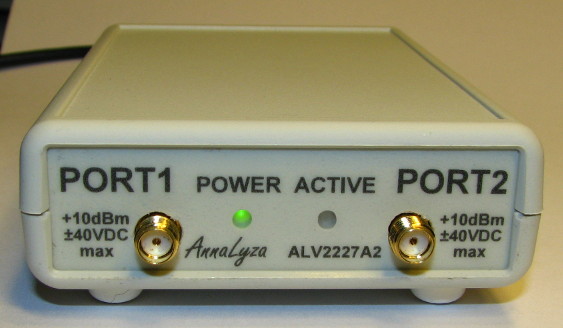
AnnaLyza VNA is a low-cost USB-based 2-port Vector Network Analyzer / Antenna Analyzer for the 2.4 GHz ISM band. The frequency range is 2200 to 2700 MHz.
The software requires Java 8 or later and has been tested under Windows 7 and 10. It has been reported to work under MacOS 10.12 and Ubuntu 18.04. You can test drive the software in a demo mode without the device to explore most functionality. The matching circuit editor is quite useful even in demo mode.
| Frequency Range | 2200 MHz to 2700 MHz |
| Impedance | 50 Ohms |
| Output Power | -18 dBm to -3 dBm (-7 dBm typical) |
| Input Power | Up to 0 dBm (+10 dBm absolute maximum) |
| Port Count | 2 |
| Port Isolation | 45 dB |
| Noise Floor | -40 to -60 dB 1 |
| RF Connector | 2x SMA |
| Data Connector | Mini USB |
| Supply Current | 300mA max |
| Dimensions | 115mm x 75mm x 30mm (4½" x 3" x 1¼") |
| Mass | 90 grams (3.2 oz) |
| Operating Temperature | 15°C to 25°C (60°F to 77°F) 2 |
1 This device only has a single receiver, so measurements with the same output port can affect each other's accuracy (S11 affects S21 and vice versa; S22 affects S12 and vice versa). The error and noise levels are typically 40 dB below the input power on the opposite port, with a lower limit of -60 dB.
2 The receiver is temperature stabilized when the device is operated in this range. The device will work from 5°C to 40°C (40°F to 105°F); however, the accuracy will be reduced. Depending on the ambient temperature the warm-up time is between 20 and 60 seconds.
This is the initial release. More features are on the way.
This section shows some measurement examples to illustrate what kind of accuracy to expect. The errors largely result from uncompensated non-linearities in the VNA's receiver and cross-talk between signals in the VNA which are not captured by the error model.
Errors are going to be worse the further away the measurement is from a calibration point (short, open, 50 Ohms). Therefore, the worst errors can be observed on the top and bottom of the Smith chart.
For the figures below I performed a full two-port calibration with the following cables: 2 meter coax cable with approximately 2 dB loss on port 1; 0.4 meter coax cable with approximately 0.8 dB loss on port 2.
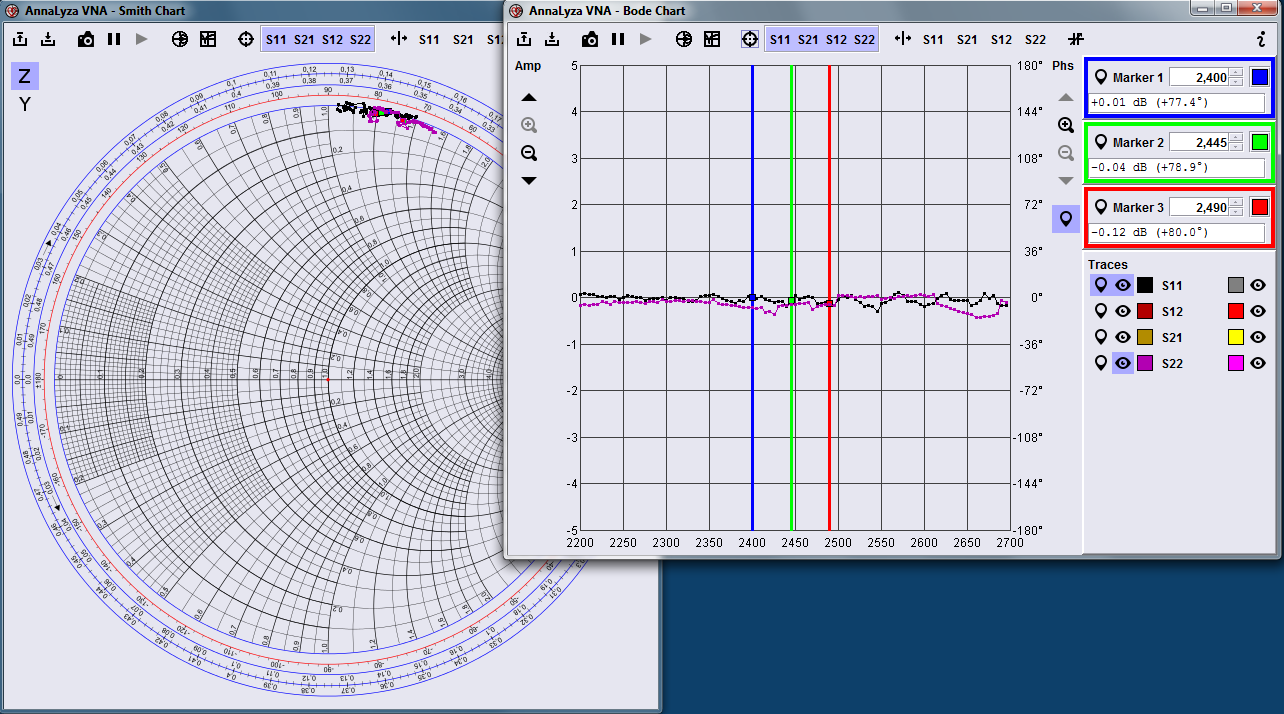
The first example is an S11 and S22 measurement with open circuit with a shorter length (calibration standards removed from the coax cables). The traces are near the top of the Smith chart, so they are at a point where the error is at a maximum.
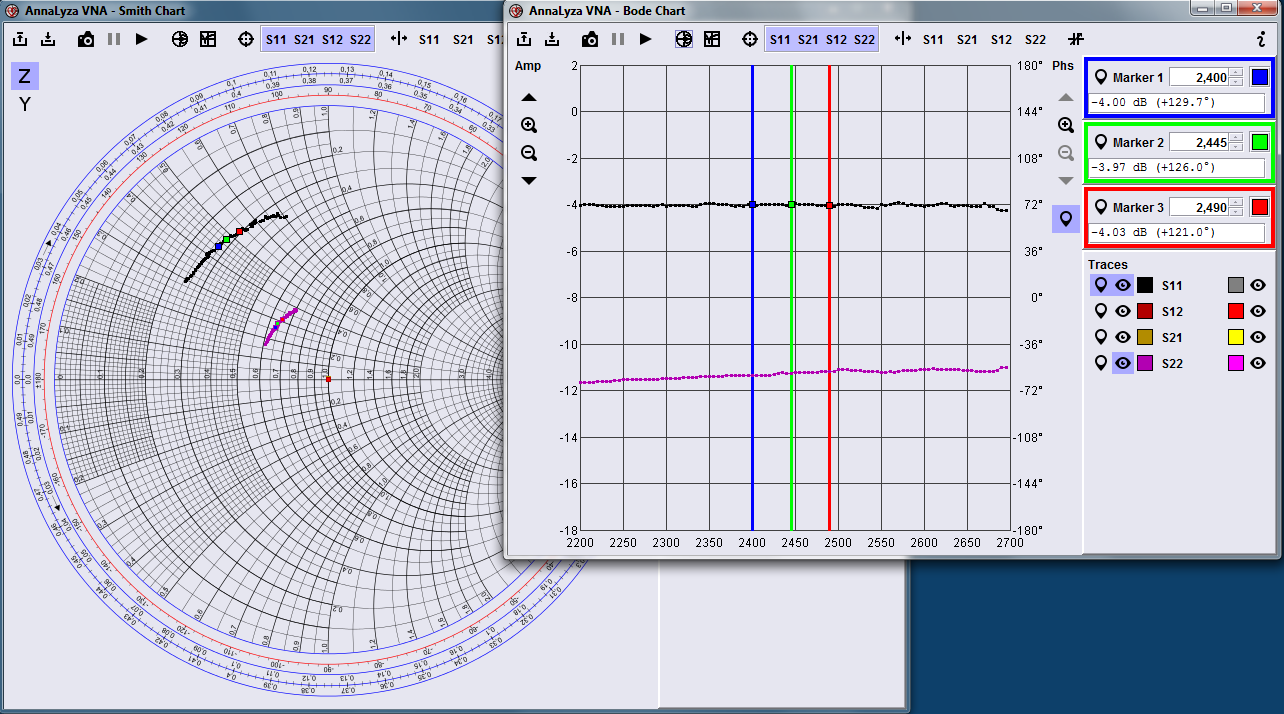
The next example is another open circuit, this time longer than in the calibration setup (SMA M/F and F/M adapters added).

The next example is with unterminated attenuators attached to the end of the cables. S11 is with a 2dB attenuator; S22 is with a 6dB attenuator.
The next example shows through measurements (S21, S12) with 2dB attenuator.

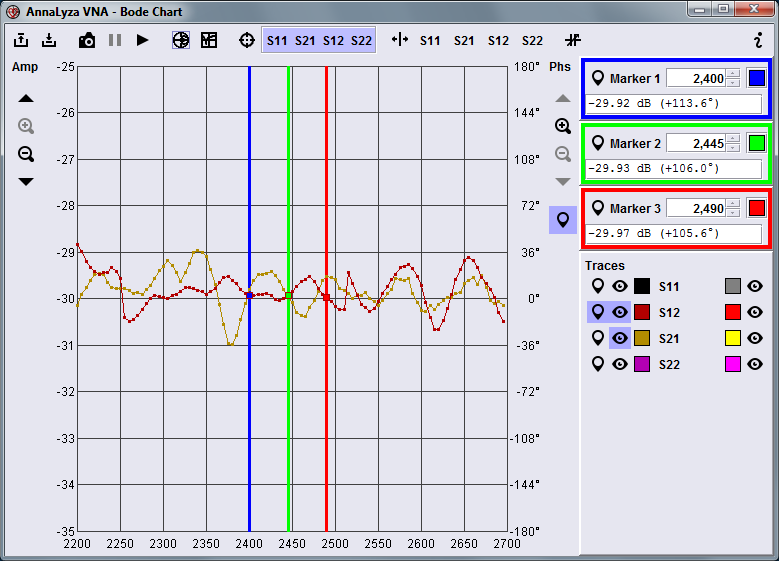
The next example shows through measurements (S21, S12) with 30dB attenuator.
The next example shows all four S-parameters with two types of antennas connected.
